Frontier LLM evals
Price against published capability scores for
14 labs. Every figure is
generated from the CSVs in data/; blank means not published,
never zero.
Writing
Both axes come from Chatbot Arena, where anonymised model responses are shown side by side and humans vote for the one they prefer; those votes are pooled into an Elo rating exactly as they would be for chess players. The vertical axis is the instruction-following rating, which scores whether a model actually obeys constraints it was given about format, structure and style — the closest thing in public to a technical-writing measure, since holding a specification is most of what technical writing is. The horizontal axis is the creative-writing rating, which tracks prose quality instead. They are plotted together because they disagree: the model that writes the nicest sentences is not the model that most reliably does what it was told. Two limits matter when reading this. Elo is relative, not absolute, so a thirty-point gap means one model wins a bit more often, not that it is thirty percent better. And the writing boards lag releases badly — neither Claude Opus 5 nor the GPT-5.6 family has been rated yet, which makes this the one chart here that is a model generation behind.

Scroll the chart sideways to read it.
Reasoning
Humanity's Last Exam is a set of roughly 2,500 questions written by subject-matter experts across more than a hundred fields, deliberately built so that answers cannot be retrieved or pattern-matched from training data and must be reasoned out. It replaced GPQA Diamond in this project because GPQA has saturated: everything at the frontier now scores 94–96 on it, which is another way of saying it no longer tells models apart. HLE still does — the best public score is under 65, so there is real distance between the leaders and everyone else. Bars are drawn from zero rather than from a cropped baseline, so the visual length of a bar is proportional to the score it represents. No lab may occupy more than four bars, which stops whichever vendor happens to ship the most checkpoints from crowding out the rest of the field.

Scroll the chart sideways to read it.
Agentic coding
Terminal-Bench 2.1 puts a model in a sandboxed terminal and gives it 89 tasks — system administration, model training, general engineering work — that it must complete by actually running commands rather than by emitting a patch. That makes it a closer analogue to how coding agents are really used than SWE-bench Verified, which this project has demoted to a continuity metric. It is also the chart where the leaderboard looks least like the others: OpenAI's GPT-5.6 tier leads it, and labs that barely register elsewhere place well. Treat gaps under about two points as ties, since scores at this level are sensitive to harness and scaffolding choices that differ between vendors. Claude Opus 5 has no Terminal-Bench result yet and so is absent rather than assumed.

Scroll the chart sideways to read it.
Price vs capability
This plots list input price against Humanity's Last Exam, with price on a logarithmic axis because the models span more than an order of magnitude and a linear axis would compress everything cheap into a single stripe. Input price is used on its own because every vendor publishes it, which avoids inventing a blended input-to-output ratio that would quietly encode an assumption about workload; output prices live in the data table and diverge further. The dashed staircase is the cost-efficiency frontier — the set of models that nothing else beats on both price and score at once. A model sitting below and right of that line is being outperformed by something cheaper, which is the most actionable thing this chart shows. Superseded models are excluded so the frame shows current lineups, invitation-only models are excluded because they cannot be bought, and each lab is capped at three marks plus any frontier members. One honest gap: OpenAI's GPT-5.6 family has published no HLE result, so it cannot appear here at all.

Scroll the chart sideways to read it.
Benchmark headroom
This chart exists to justify the other four. Every benchmark eventually saturates — models climb until the ceiling, and the remaining differences fall inside the noise of how each vendor ran the evaluation. The filled bar is the best public score and the track runs to 100, so the empty tail is simply how much room is left. On that measure SWE-bench Verified is finished as a way to separate frontier models: the leader sits at 96.0, the top three are inside a single point, and later audits found flawed or underspecified test cases concentrated exactly where those scores now cluster. It is greyed out and kept only so the historical series stays unbroken. Humanity's Last Exam, by contrast, still has around thirty-five points of headroom. The hollow ring marks fifth place, giving a rough sense of how tightly the leaders are bunched independently of where the ceiling sits.

Scroll the chart sideways to read it.
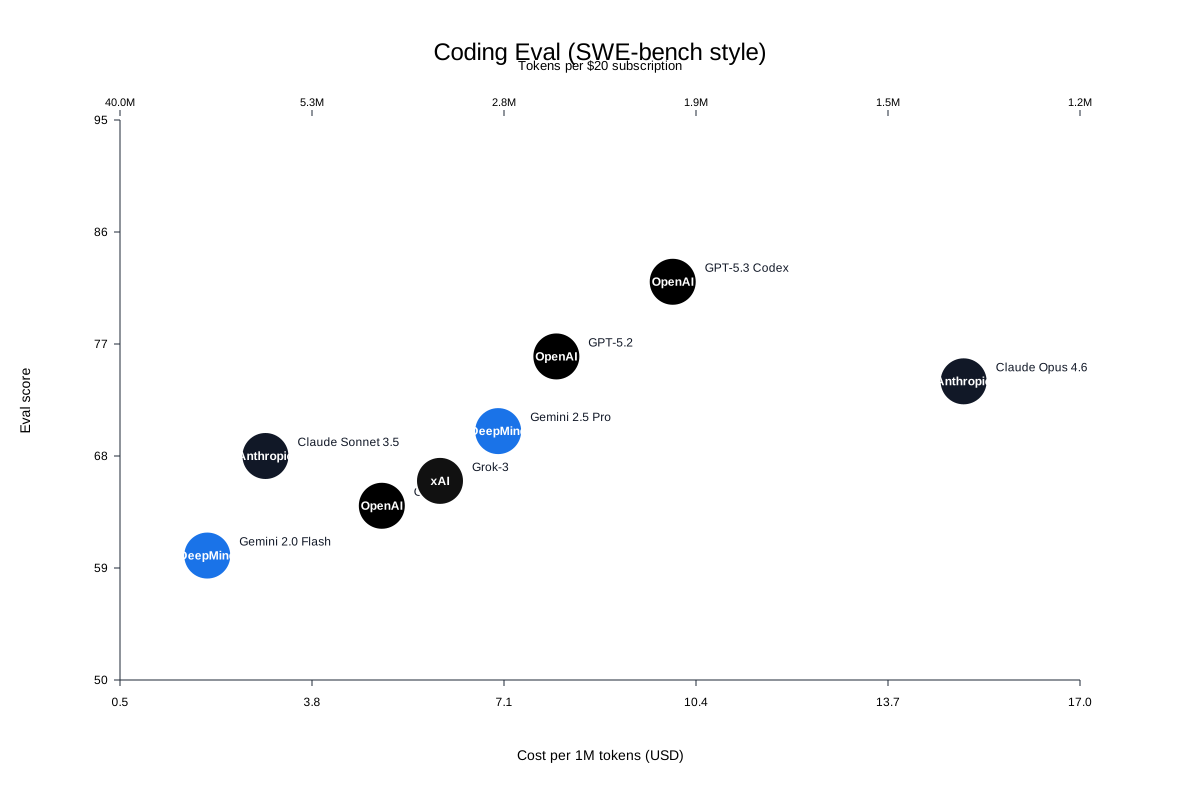
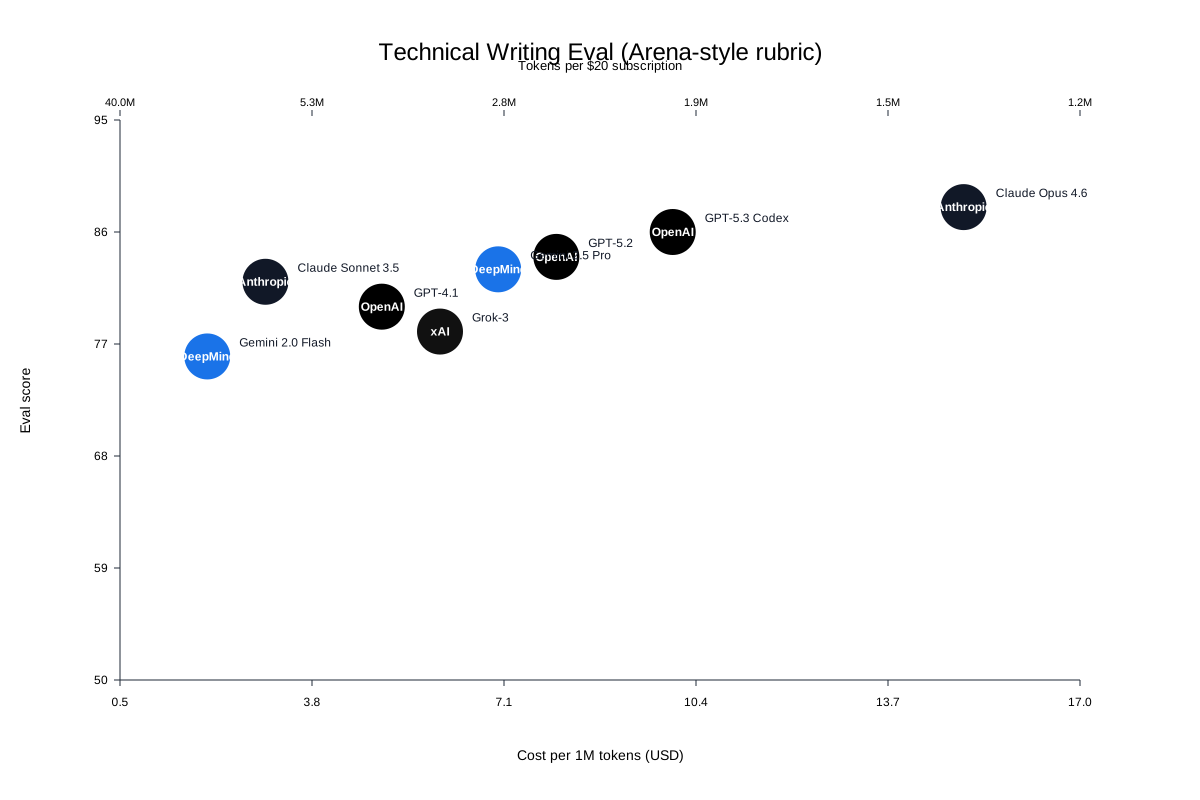
These are the repo's original figures, recovered from commit ce0ab3c (2026-02-08) and kept for continuity.
The numbers in them are not real. The data file behind them was placeholder scaffolding — the README of the day said the scores and prices were "illustrative so you can swap in your preferred benchmark scores and pricing." The models are also a mix of real and invented names, and the two benchmarks ("technical writing eval", "coding eval") were generic rubrics, not published benchmarks anyone ran.
They are archived as a record of what the project looked like, not as a data snapshot. Do not read trends across this folder and the dated snapshots that follow it, and do not migrate these numbers into data/.
The figures also predate the current chart conventions: single light-only variant, and company names rendered inside the markers — which is the label overflow bug that prompted the rewrite.
Coding eval
Scroll the chart sideways to read it.
Technical writing eval
Scroll the chart sideways to read it.